
Cold Chain Packout Cost: A Transparent Comparison Worksheet
A transparent cost worksheet for cold chain packout: materials, labor, monitoring, return logistics and losses, with formulas and blank cells you fill in.

The comparison question
Packaging quotes are usually compared by unit price: this box costs less than that box. A shipment’s real cost includes the refrigerant, the minutes spent packing it, the logger, the freight, the return of reusable parts and the cost of the occasional failure. A cheap box with high labor time or a high loss rate can cost more per shipment than a dearer box that goes together quickly.
This worksheet gives you a structure to compare options on the same basis. It contains no market prices, and none are implied. Every cost cell is yours to fill. Related guides sit in the procurement section.
Scope note: This worksheet is a method for organizing costs. It does not tell you which packaging option is cheaper, because that depends on your lanes, volumes, labor rates and loss history. Any numbers shown here are marked as an illustrative example and are hypothetical.
Common premises for a fair comparison
Fix these before you enter any cost, and apply the same ones to every option.
- Same lane set and season: compare options for the same routes and the same ambient conditions.
- Same protection target: each option must meet the same documented temperature range and time requirement, backed by evidence. Reading that evidence is covered in the guide on qualification report review. An option that misses the target is not a cheaper option.
- Same period: pick a period, such as a quarter or a year, and count shipments in that period.
- Same boundary: decide what is inside the cost: your site only, or origin to final return of reusable parts.
- Same data source: say where each figure comes from: supplier quote, internal accounts, time study, or estimate. Mark estimates as estimates.
What goes into the cost per shipment
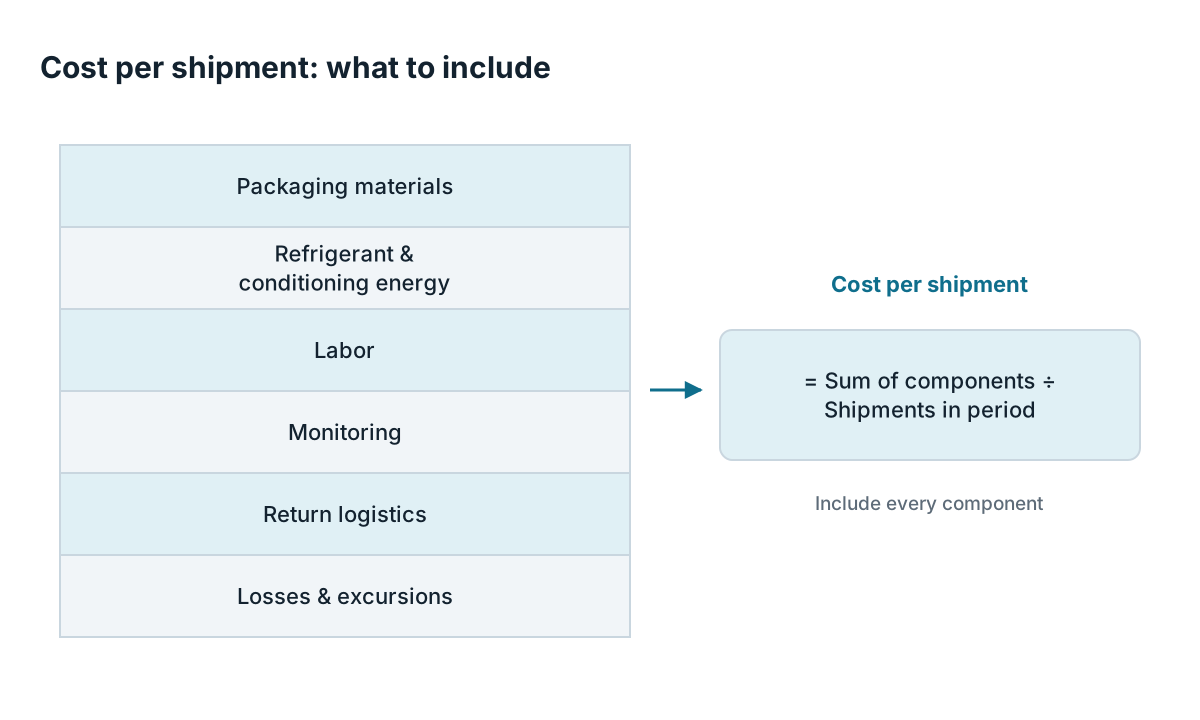
The diagram shows the six components as a stack, with the formula on the right. It shows no values, because they differ for each user.
Data sources for each component
| Component | Where the data comes from | Typical traps |
|---|---|---|
| Packaging materials | Supplier quotes, purchase orders | Quotes that exclude inserts, tape or labels |
| Refrigerant and conditioning | Supplier quotes, utility bills, freezer or cold room capacity | Ignoring freezer space and the energy used to condition packs, and dry ice handling and surcharges |
| Labor | Time study at your packing station, wage plus overhead | Using a supplier’s quoted assembly time instead of your own |
| Monitoring | Logger prices, software fees, data handling time | Counting logger purchase but not reading, reporting and replacement |
| Return logistics | Carrier quotes, handling and cleaning time (reusable only) | Treating returns as free, or forgetting lost units |
| Losses and excursions | Complaint and deviation records, product value | Using a guess for loss rate with no record behind it |
If you use real-time devices, the guide on real-time vs offline monitoring explains what each approach costs in handling and data, which feeds the monitoring row.
The worksheet
Fill the white cells yourself. Keep one worksheet per option and per lane group. Formulas use these symbols: N is the number of shipments in the period, and a letter with a subscript or name stands for the value you enter.
| Line | Item | Input or formula | Your value |
|---|---|---|---|
| A | Shipments in period (N) | Count from records | ____ |
| B1 | Outer carton and insulated shipper, per unit | Quote or purchase price | ____ |
| B2 | Inserts, liners, tape, labels, per shipment | Sum of per-shipment parts | ____ |
| B3 | Packaging materials per shipment | B1 + B2, divided by reuse cycles if the shipper is reusable | ____ |
| C1 | Refrigerant units per shipment | From the packing instruction | ____ |
| C2 | Cost per refrigerant unit, including conditioning energy and storage | Quote plus internal estimate | ____ |
| C3 | Refrigerant cost per shipment | C1 × C2 | ____ |
| D1 | Packout time per shipment (minutes) | Time study | ____ |
| D2 | Labor rate per minute, including overhead | Finance figure | ____ |
| D3 | Labor per shipment | D1 × D2 | ____ |
| E1 | Logger or indicator cost per shipment | Unit price, divided by reuse cycles if reusable | ____ |
| E2 | Data handling cost per shipment | Time to read and file × labor rate, plus any service fee | ____ |
| E3 | Monitoring per shipment | E1 + E2 | ____ |
| F1 | Return transport cost per shipment returned | Carrier quote | ____ |
| F2 | Cleaning, inspection and repacking per returned unit | Time study × labor rate, plus consumables | ____ |
| F3 | Return rate (share of shipped units returned) | Returned ÷ shipped | ____ |
| F4 | Return logistics per shipment | F3 × (F1 + F2) | ____ |
| G1 | Number of failures or excursions in period | From complaints and deviation records | ____ |
| G2 | Average cost per failure, including product, reshipment and investigation | Internal estimate, labeled as such | ____ |
| G3 | Losses per shipment | (G1 × G2) ÷ N | ____ |
| H | Cost per shipment (excluding freight) | B3 + C3 + D3 + E3 + F4 + G3 | ____ |
Outbound freight is left out because it often depends on weight and volume, and the shipper’s size changes it. Add a line for it if your options differ in dimensional weight, and note the basis.
Illustrative example
The figures below are hypothetical and exist only to show how the formulas connect. They are not prices, benchmarks or findings. Unit labels are omitted on purpose.
Option X has materials per shipment of 4, refrigerant of 2, labor of 3, monitoring of 1, return logistics of 0 and losses of 1, so H = 4 + 2 + 3 + 1 + 0 + 1 = 11. Option Y has materials of 2, refrigerant of 2, labor of 5, monitoring of 1, return logistics of 2 and losses of 2, so H = 14. In this made-up case, Option Y looks cheaper on materials and dearer overall, because labor, return handling and losses outweigh the material saving.
The example shows only the pattern. With your own data the ranking can reverse.
Conditional analysis: how the answer shifts
Which component dominates depends on conditions. Use these as prompts for your own data.
- Reusable shippers: materials per shipment fall as reuse cycles rise, but return logistics, cleaning and loss of units rise. The break-even depends on return rate, so measure it before you trust any cycle count. The guide on reusable shipper operations covers the operating steps behind lines F1 to F4.
- Single-use shippers: return logistics drop to zero. Disposal fees and storage space for bulky empty boxes may belong in materials.
- High packout labor: if packers spend longer on complex assembly, labor can outweigh material savings. Time your own station.
- Long or hot lanes: extra refrigerant, a larger shipper or active systems raise cost, and a loss on a high-value shipment can exceed all other lines. Compare options with the guide on insulated shipper selection.
- Automation: equipment lowers D3 but adds capital, maintenance and downtime. Put its cost in a separate line, and use the equipment RFQ checklist to make quotes comparable.
- Regulatory add-ons: air shipments and dry ice carry documentation and handling rules, such as those in IATA’s Temperature Control Regulations and Dangerous Goods Regulations. Check current versions and add the real costs you incur.
Contract and data points to pin down
- Quote validity period and what triggers a price change.
- Minimum order quantities and storage responsibility.
- Whether quoted unit prices include inserts and printed labels.
- Who pays for retesting if the supplier changes materials.
- How returns are counted and what happens to lost units.
- What each party records, so G1 and F3 have a reliable source.
Worksheet checklist
- Lane set, season, protection target and period are the same for all options.
- Evidence that each option meets the target is on file.
- Every input has a stated source, and estimates are marked.
- Packout time comes from a time study at your own station.
- Monitoring cost includes data handling as well as the device.
- Return rate for reusable shippers comes from records.
- Loss and excursion cost uses your deviation history.
- Freight is added if options differ in size or weight.
- Results are reviewed by operations, finance and quality.
- Sensitivity is checked: change the biggest line by a plausible range and see if the ranking holds.
What this worksheet does not settle
The worksheet shows how costs add up. It cannot tell you what your costs are or rank packaging types. It leaves out capital depreciation, tax, brand and customer effects, and sustainability accounting, unless you add lines for them. A loss figure is only as good as your records, and rare events are hard to estimate from a short period. Standards and regulations are named for context only: check the current versions, and ask finance and quality teams to review the inputs before you use the result in a purchase decision.
Related guides
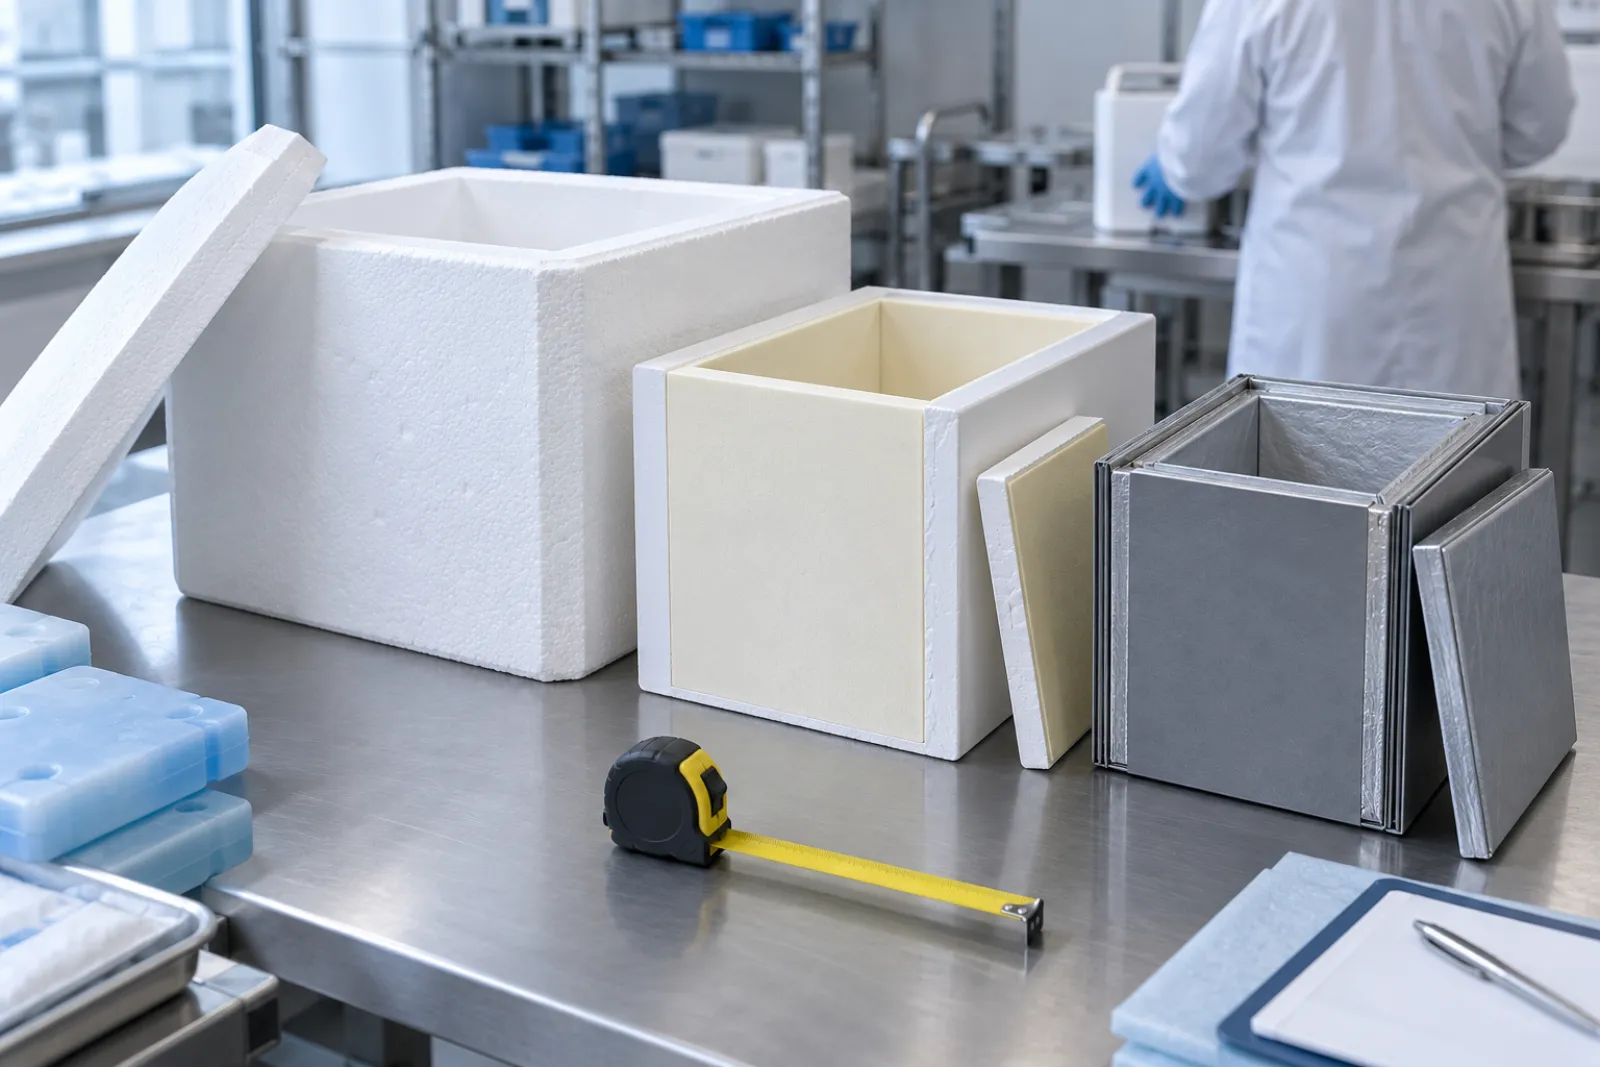
Selecting Insulated Shippers: Payload, Transit Time and Handling Constraints
Turn payload, transit time, ambient conditions, dimensions and handling into clear purchasing inputs for insulated shipper selection and supplier quotes.
Read guide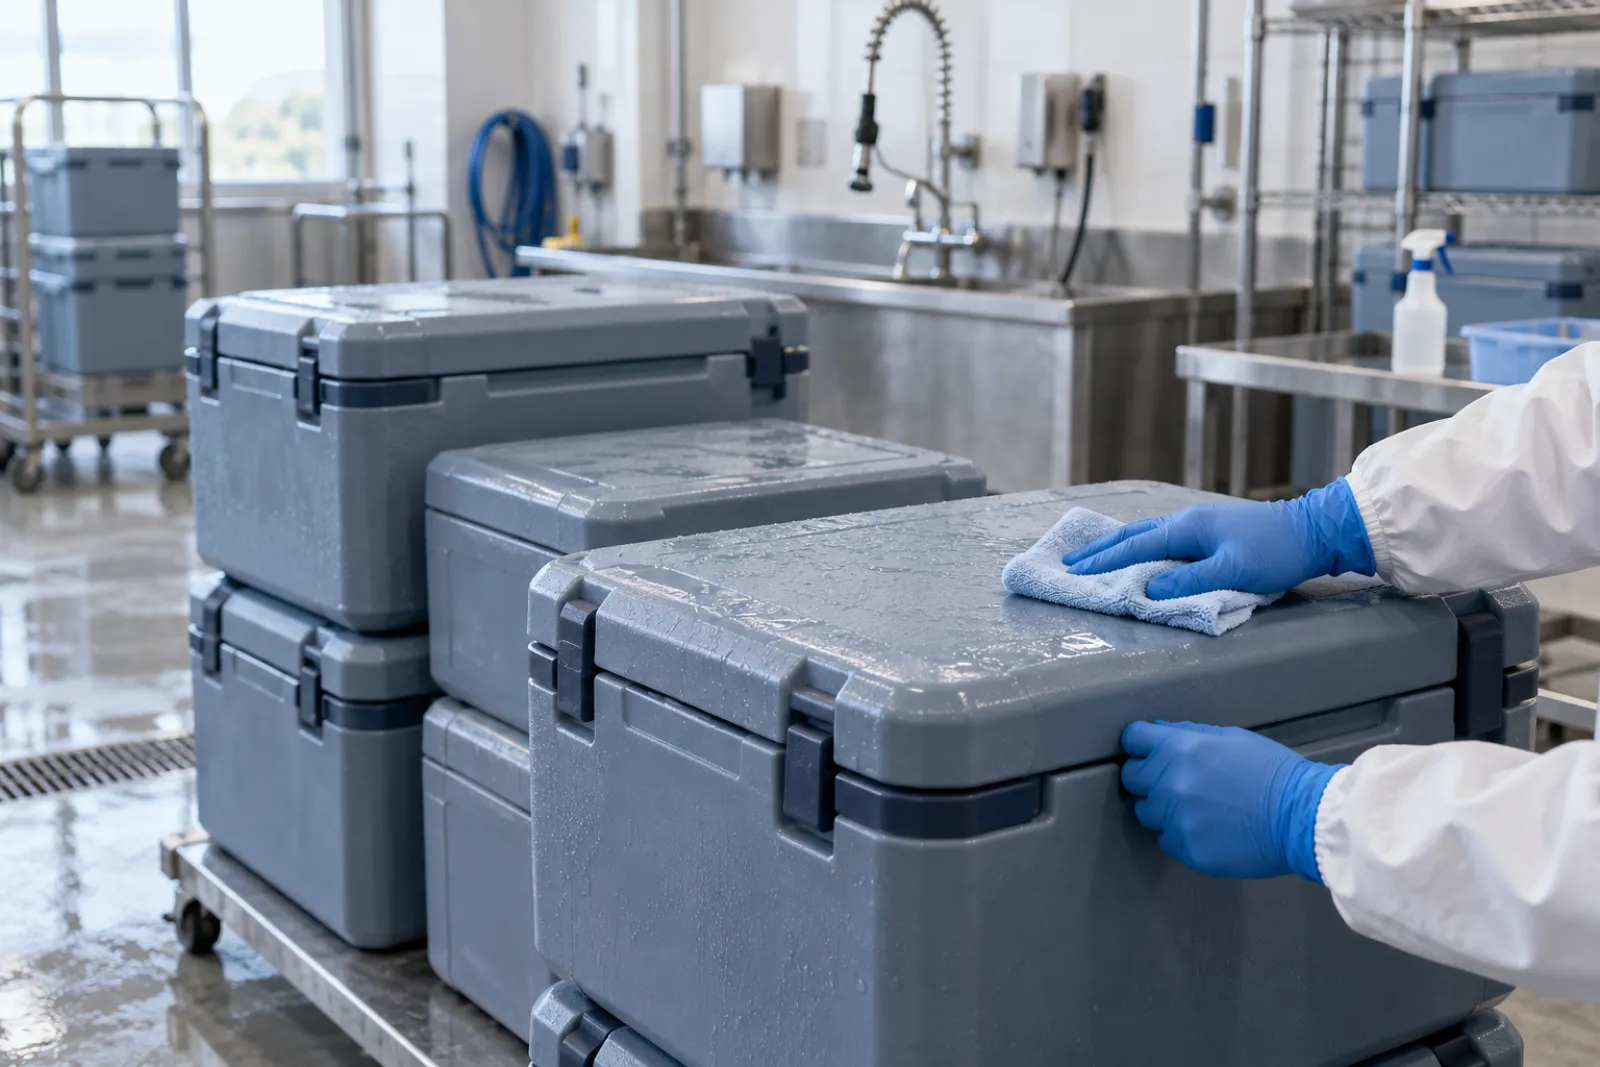
Reusable Thermal Shippers: Return Logistics, Cleaning and Rotation
Compare return flows, cleaning responsibility, rotation, losses and total cost when you run reusable thermal shippers, with a checklist for operations teams.
Read guide
Real-Time Tracking or Downloadable Loggers: Which Workflow Fits?
Compare real-time and downloadable temperature monitoring by when data arrives, alarm response, network dependence and cost structure, lane by lane.
Read guide
Cold Chain Equipment Procurement: A Practical RFQ Checklist
Turn capacity, environment, interfaces, evidence, service and acceptance needs into a clear RFQ, with a copy-ready field table for packout equipment buyers.
Read guide